
APPENDIX
D: DISCHARGE AND DEPOSITS INTO THE MONTEREY BAY AREA
Discharge and Deposits into the Monterey Bay Area
FIGURE D-1
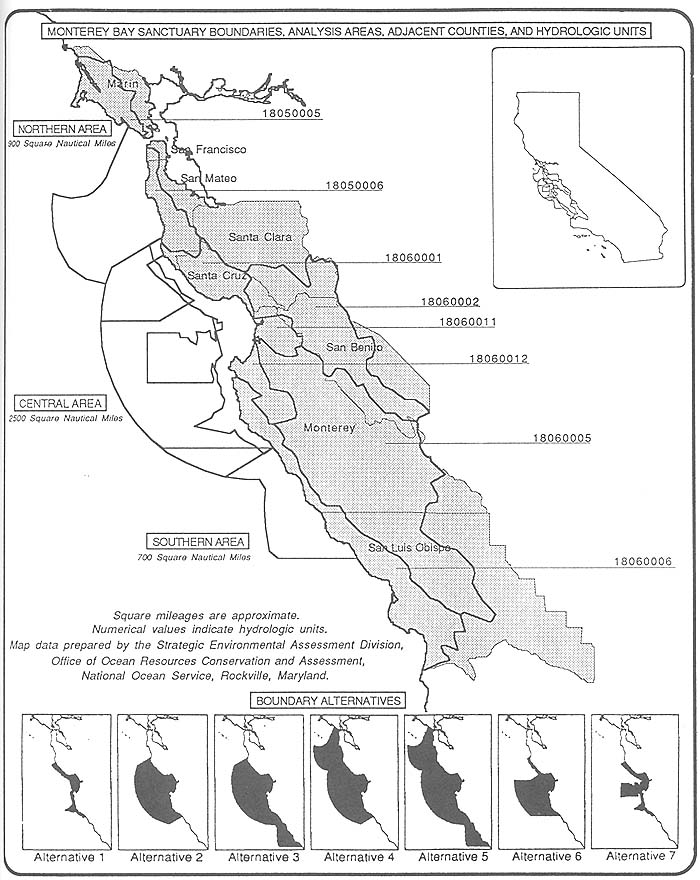
Figure D-1 shows the entire study area and proposed boundaries for the Monterey Bay National Marine Sanctuary. The study area, preferred boundary alternative #5, was divided into three areas: (1) the Central Area, corresponding to Boundary Alternative #2 and watersheds that drained into this alternative; (2) the Northern Area, which corresponds only to the northern extension provided by Boundary Alternative #4, and watersheds that drained into this northern area, and (3) the Southern Area, which corresponds only to the southern extension provided by Boundary Alternative #3 and watersheds that drained into this southern area. The following tables and figures subdivide the discharge and deposit data first by these three analysis areas, (north, central, south) and then subdivide the data by watershed (Hydrographic Unit) and county.
TABLE D-1
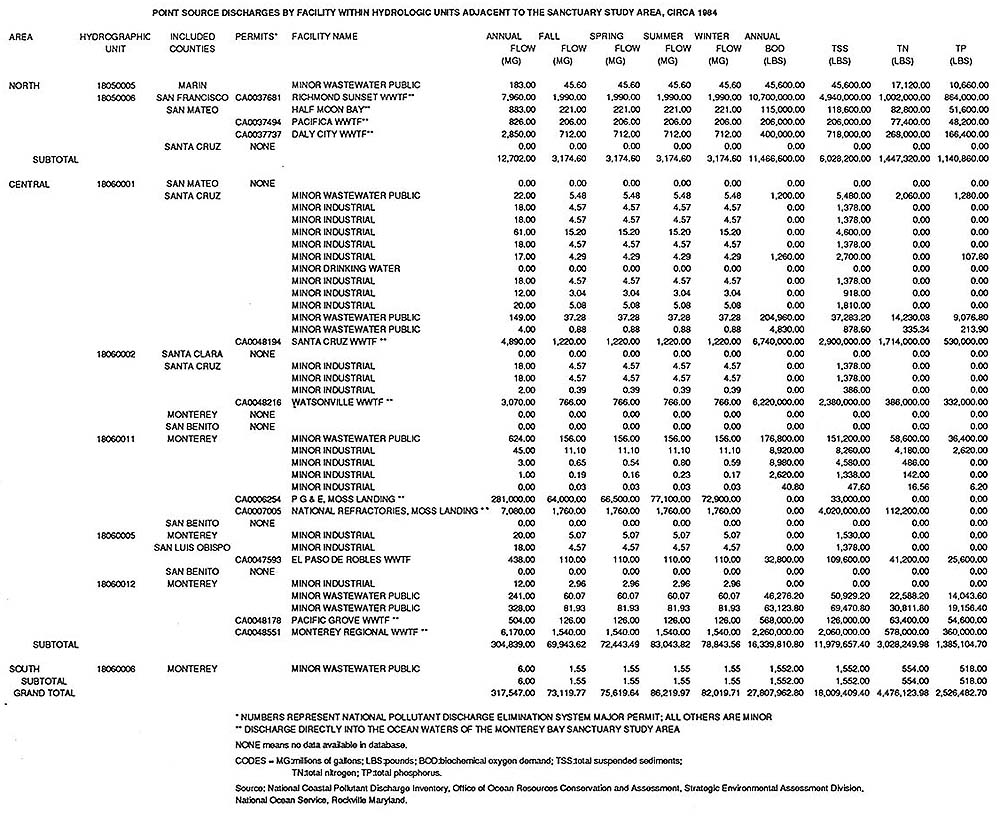
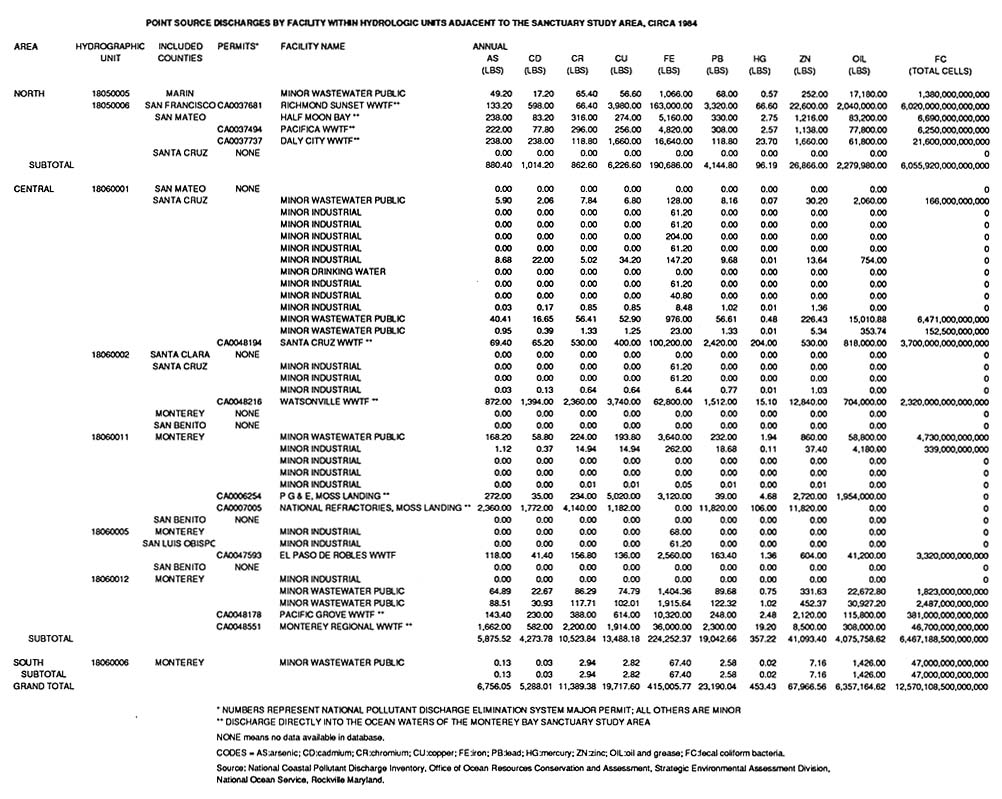
Table D-1 shows the amounts and seasonal loadings of pollutants from Point Source dischargers, by analysis area, hydrographic unit and county. This data is derived by using values from either Permits, monitoring data, or modeling predictions. It should be noted that this data is approximately ten years old. This information is provided to give an estimate of relative loadings between analysis areas and an estimate of cumulative loadings rather than to determine the exact pollutant contribution from any one discharge source.
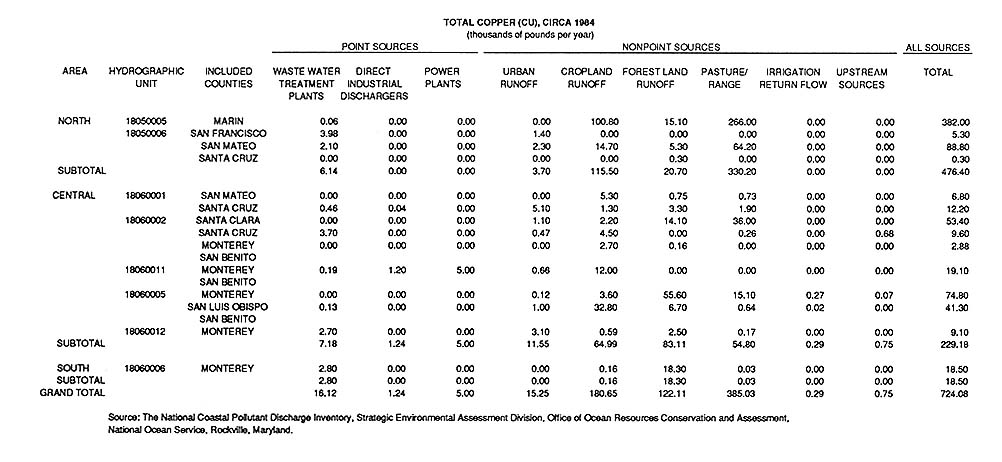
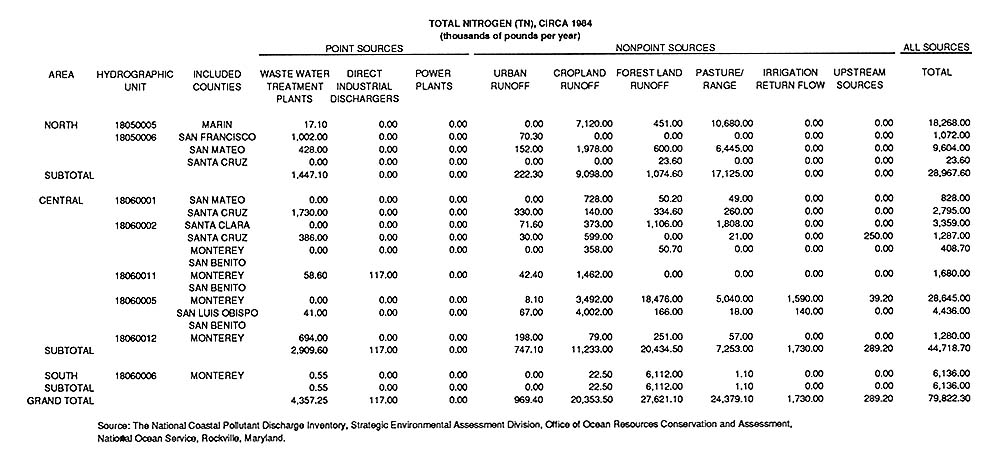
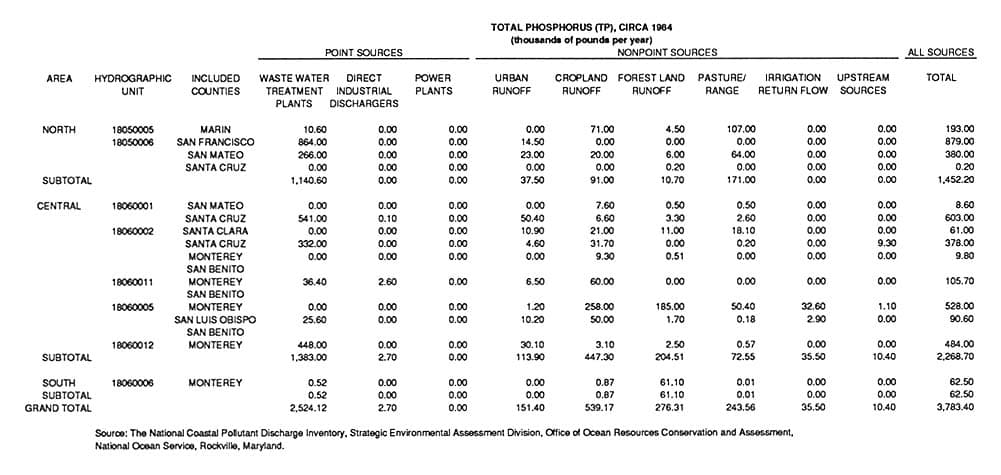
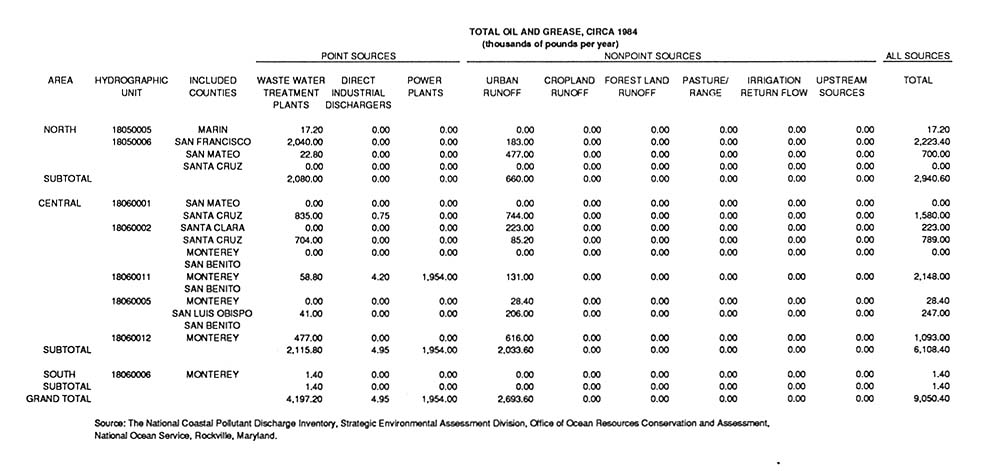
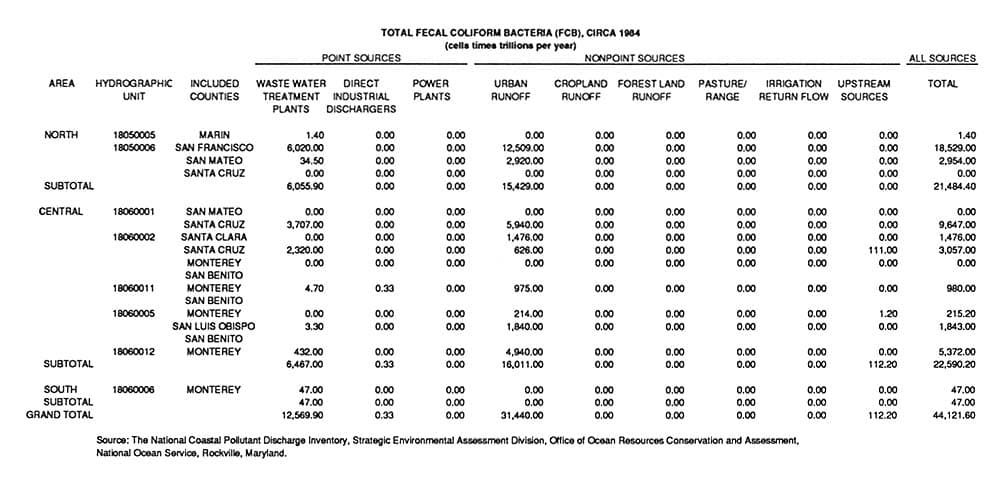
TABLE D-2
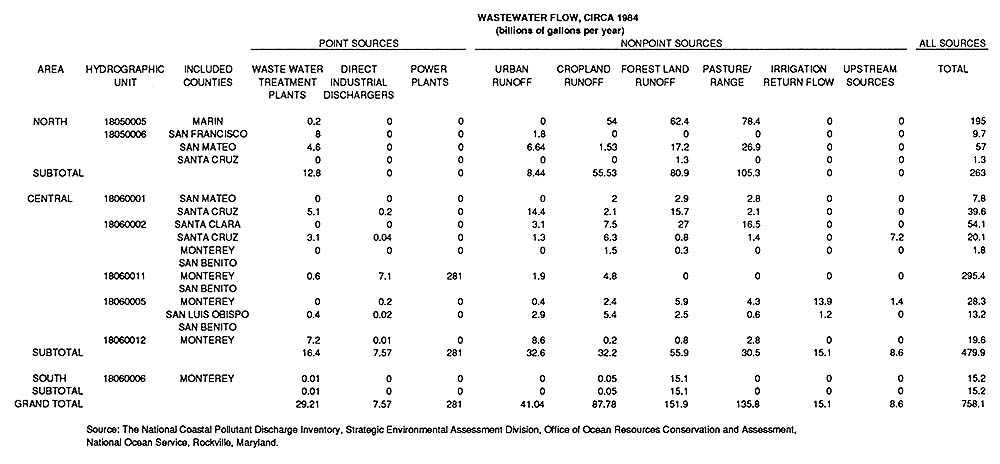
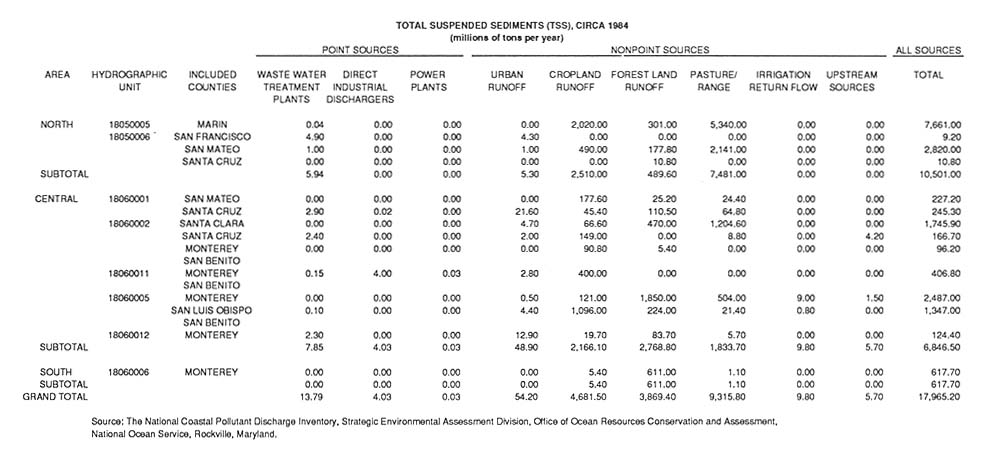
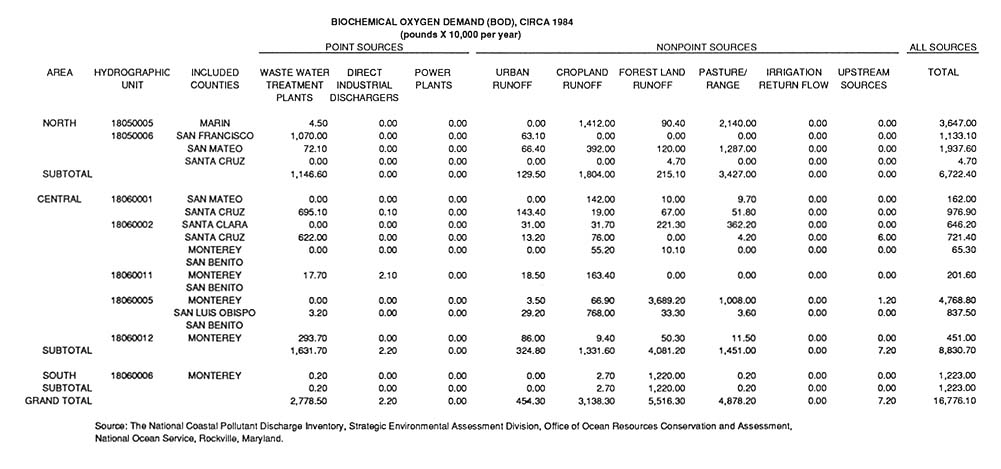
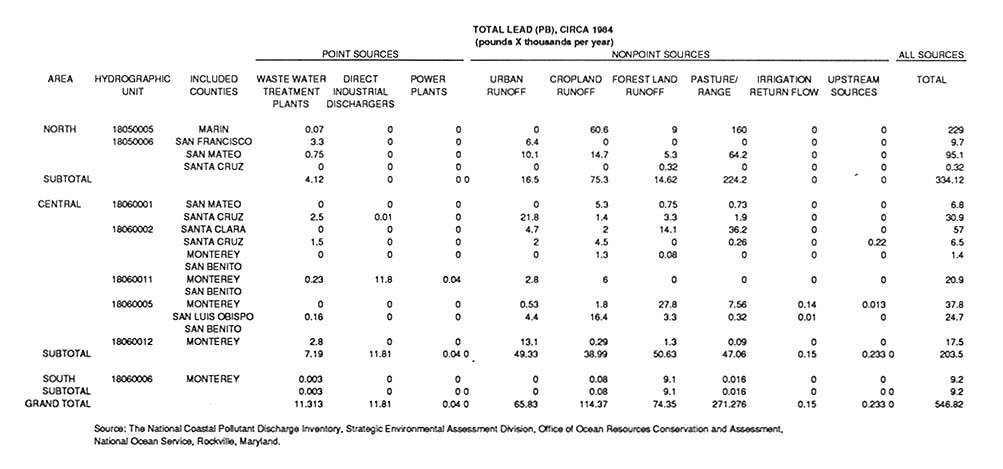
Table D-2 shows the relative loadings from point source and various non-point sources in the Monterey Bay area by analysis area, hydrographic unit and county. Data is shown for a variety of pollutant constituents including total wastewater flow, total suspended sediments, biochemical oxygen demand, total lead, total copper, total nitrogen, total phosphorus, total oil and grease, and total fecal coliform bacteria.
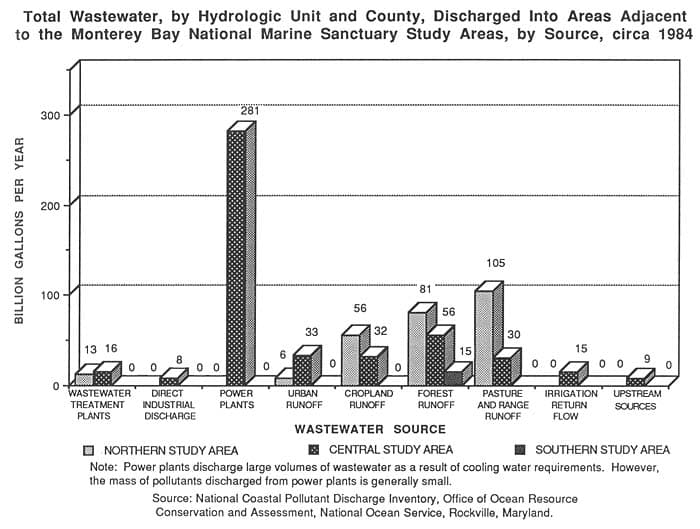
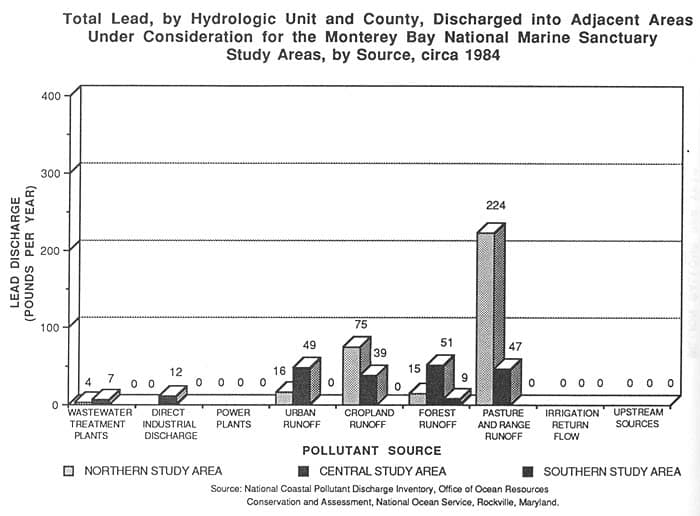
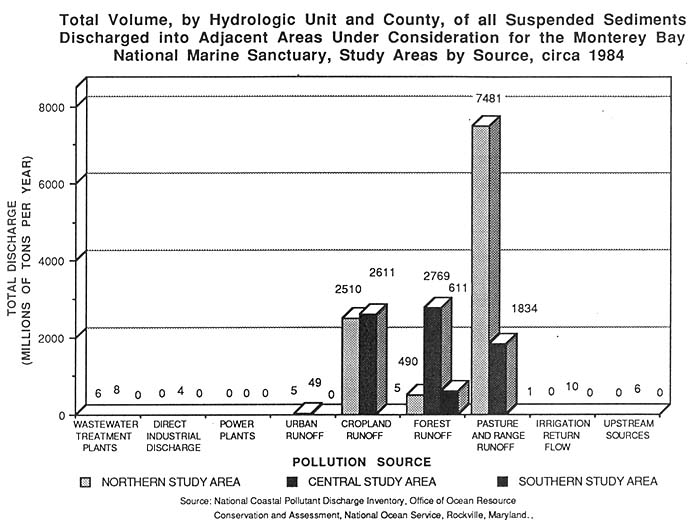
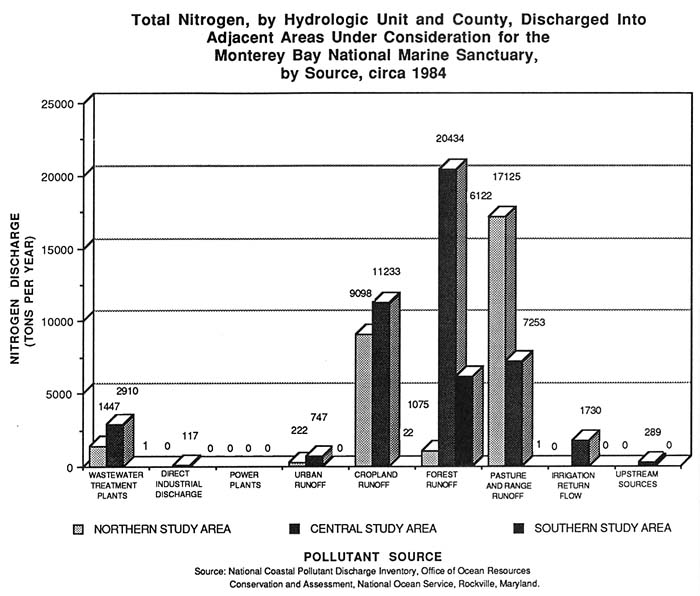
FIGURE D-2
Figure D-2 illustrates in graphic form the data provided in Table D-2 for the pollutant constituents total wastewater flow, total lead, total suspended sediments, and total nitrogen.