Guiding
Question
What if you were to conduct a horizontal transect in Monterey Bay
National Marine Sanctuary, based upon the habitat types along your
transect, what species would you expect to find? (See
Background.)
Materials
Discussion
|
The information for this activity may
be substituted with that from another
sanctuary. For example, the Florida Keys
National Marine Sanctuary website has
information about the coral reef habitat.
Check out https://floridakeys.noaa.gov
|
As a result of extensive studies of the seafloor
in Monterey Bay National Marine Sanctuary, much is
known about its topography and sediment types.
Sediment type is one of many factors that define
the kinds of algae and animals living in a
particular area. By knowing these sediment types,
and the habitats preferred by different species,
scientists can predict what organisms they might
find in an area. Using underwater submersibles and
other scientific equipment, scientists can compare
their predictions with actual findings.
MBNMS contains one of the world's most
geologically diverse and complex seafloors and
continental margins. The MBNMS is located on a
plate boundary which separates the North American
Plate from the Pacific Plate, and is marked by the
San Andreas fault system. This is an active
tectonic region with common occurrences of
earthquakes, submarine landslides, flood discharges
and coastal erosion. It is also a region of
extensive natural and economic resources. Coastal
topography varies greatly, encompassing steep
bluffs with flat-topped terraces and pocket beaches
to the north; large sandy beaches bordered by cliff
and large dune fields mid-sanctuary; and
predominately steep, rocky cliffs to the south.
Low-to high-relief mountain ranges and broad,
flat-floored valleys are prevalent farther inland.
(From Geology section of MBNMS Site
Characterization at website: https://montereybay.nos.noaa.gov/sitechar/geol2.html#2b)
Procedure:
|
1
|
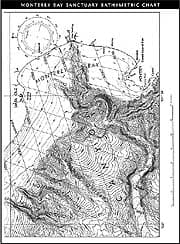
Give each student a copy of the MBNMS
Chart. Discuss with your students the
different features on the map (contour
lines reveal different seafloor features
such as the continental shelf, canyons,
seamounts, and banks). Discuss how
geologists create these maps. (See below.)
What are some ways scientists might use
these maps? (Map data allows us to get a
picture of the seafloor & its
habitats. This tells us a lot about what
plants and animals live there).
|
|
2
|
Explain to students that scientists
conduct transect studies as one way to
characterize the geological, physical, and
biological characteristics of an
ecosystem. Tell students that they are
going to plan a research cruise in the
Monterey Bay Sanctuary using an underwater
submersible.
Please see "Meet DeepWorker" background
information. Have students select a horizontal transect
on their maps that they would be interested in studying.
How do you determine the length and depth of a transect?
The transect should be a straight line from one point on
the map to another. Using a ruler, have each student draw
a straight line on their map to indicate the location of
the transect.
|
|
3
|
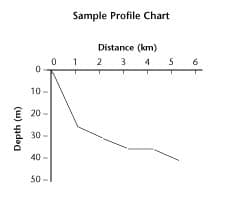
To help illustrate the underwater
topography along a transect, have students
make profile charts. On a separate piece
of paper, have them create a "T" table:
one column for distance from the starting
point of their transect (Point A) and one
for depth of the seafloor. Then have them
collect data at every centimeter along
their transect using the scale 1cm = 1 km.
For example, measuring one centimeter on
the ruler from Point A (which is equal to
one kilometer from the starting point of
their transect), the contour line
indicates depth is 25 meters. At two
centimeters (or two kilometers from Point
A), the depth is 30 meters. (See following
example).
Mapping the Seafloor
Data
Transect in Monterey Bay
National
Marine Sanctuary
|
|
Distance from
start
|
Depth of
Seafloor
|
|
0 km
|
0 m
|
|
1 km
|
25 m
|
|
2 km
|
30 m
|
|
3 km
|
30 m
|
|
4 km
|
35 m
|
|
|
4
|
Once students have collected data along
their transects and created data tables,
have them create profile charts to show
the underwater topography. If computer
graphing capabilities are not available,
hand out graph paper and have students
title and label their graphs: distance
(km) along the bottom or X axis, and depth
increments (m) along the side or Y axis.
Students can refer to their data tables
for ranges of values.
|
|
5
|
Have students use their data tables to
plot the points on their profile charts,
then draw a profile by connecting the
points on the chart.
|
|
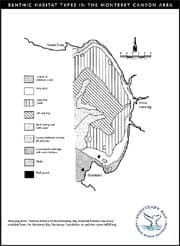
6
|
Give each student a copy of the
Benthic Habitat Types handout. Have
them determine what kinds of sediments
they would find along their transects and
indicate these on their maps. Encourage
students to ask questions about their
findings; for instance, "Where did these
sediments come from?," "How did they get
here?," "Why are they distributed as they
are in different zones?" Students may not
have answers to these questions, but
asking them is an essential part of doing
science and is the first step in
scientific inquiry. For more information,
refer to the book "Natural History of
Monterey Bay National Marine
Sanctuary."
|
|
7
|
Give each student a copy of the
Animal Species handout. Based on
the sediments found along their transects,
what species would they expect to find?
What is their reasoning to support these
expectations?
|
|
8
|
|
One of the fishes inhabiting
NOAA's Monterey Bay National
Marine Sanctuary is the center of
study for an Expeditions
investigation. Rockfish
(Sebastes spp.) congregate
in particular habitats in MBNMS.
A related species, the Redfish
(Sebastes fasciatus)
inhabit similar areas in NOAA's
Stellwagen Banks National Marine
Sanctuary. By comparing the day
and night habits of these two
fish, scientists hope to find
relationships between them which
might prove useful when making
decisions to best protect their
populations.
|
Discuss with students the relationships
among the organisms, their physical
surroundings, and their geographical
location. What physical conditions does
each organism favor? Does the organism's
predators and prey favor the same
conditions? What kinds of patterns can be
seen among organisms, physical conditions,
and their geographical location?
|
|
9
|
If you have access to the Internet,
have students refer to the Sustainable
Seas Expeditions website (https://oceanservice.noaa.gov/websites/retiredsites/supp_sseretired.html
and https://www.nationalgeographic.com/seas/)
to follow the research being conducted in
Monterey Bay National Marine Sanctuary.
What species are the Sustainable Seas
Expeditions researchers finding? How do
these findings compare with the
predictions made by students?
|
|
10
|
Have students write a detailed
description of their findings. If they
were able to follow the Sustainable Seas
Expeditions research project on the web,
have them draw conclusions about their
predictions and the actual findings.
|
|
How are
seafloor maps created?
In Most of our knowledge about seafloor
topography comes from soundings: sending
sound waves into the water and measuring
the time it takes for them to bounce off
the ocean floor and return. From these
soundings, scientists can create a map of
the seafloor.
The device used to send sound waves is
called an echo sounder, or sonar. Towed
behind a ship, it bounces about 120 narrow
beams of sound, also called "pings," off
the seafloor several times per second.
Another instrument collects the sound that
echoes back. The ship passes back and
forth over a given area, much the way you
mow a lawn, sending these many beams of
sound as it goes. A computer on board the
boat calculates the depth based on the
time it takes for the echo of the beam to
return to the surface. Sound travels
through the ocean at an average speed of
1,460 meters (4,800 feet) per second.
(Sound travels about five times faster
through water than it does through air.)
To calculate the depth, divide the total
amount of time it takes for a ping to hit
the bottom and bounce back by two. (You
divide by two because the total includes
the trip down and back.) Then multiply
that figure by 1,460. For instance, if it
takes two seconds for sound to return to
the ship, the water must be 1,460 meters
deep.
At the same time, the sonar gathers
information about the composition of the
ocean floor by measuring the strength of
the returning signal.
For example, mud absorbs sound,
therefore a muted echo indicates a muddy
bottom. A strong echo indicates a rocky
bottom. Scientists supplement these sonar
images with videos, still photographs, and
samples.
For more information on seafloor
mapping, see: http://sustainableseas.noaa.gov/missions/channel2/background/sonar.html
|
a PDF version of these images can be found in the fullcurr.pdf
document (2.7mb)
ANIMAL
SPECIES IN THE MONTEREY BY NATIONAL MARINE
SANCTUARY
|
|
Common
Name: Olive
snail
Scientific
Name: Olivella
biplicata
Habitat
Preference: fine
sand
Prey: algae
& dead animals
Predators: sea
stars

|
|
Common
Name: Red
octopus
Scientific
Name: Octopus
Habitat
Preference: rocky
outcrops
Prey: small
crustaceans, mollusks
and fishes
Predators: demersal
fish, herring, striped
bass, sea turtles,
humans
|
|
Common
Name: Pismo
clam
Scientific
Name: Tivela
stultorum
Habitat
Preference: coarse
and medium sand
Prey: phytoplankton,
small detritus
Predators: sea
otters, crabs, moon
snails, sharks, rays,
shorebirds, &
humans
|
|
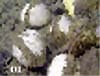 Common
Name: Cold seep
clams Common
Name: Cold seep
clams
Scientific
Name: Calyptogena
spp.
Habitat
Preference: Cold
seep areas in the deep
canyon floor.
Coarse sediment with
silt and clay
Prey: chemosynthetic
bacteria live in the
clams gill tissues and
provide their sole
source of nutrition
Predators: unknown
|
|
Common
Name: Sea
stars
Scientific Name:
Patira miniata
(bat star), Pisaster
giganteus(Giant
seastar), Astropecten
armatus (sand
star),
Habitat
Preference: coarse
and medium sand,
rocks
Prey: bivalves,
small crustaceans,
worms, other
echinoderms, detritus,
carcasses, tunicates,
hydroids, sea anemones,
sponges
Predators: larger
sea stars, gulls &
humans
|
|
Common
Name: Hydroid
Scientific Name:
Aglaophenia spp.
(ostrich-plumed)
Habitat
Preference: gravel,
sand
Prey: zooplankton,
phytoplankton, small
detritus
Predators: nudibranchs,
echinoderms, benthic
fish (flounders,
sculpins)
|
|
Common
Name: Nudibranchs
& Opistobranchs
Scientific
Name: Anisodoris
noblis (Sea lemon),
Pleurobrachia
california (Deep sea
hare)
Habitat
Preference: rocky
outcrops
Prey: (selective
by species) hydroids,
sea anemones,
cerianthids, corals,
bryozoans, sponges
Predators: sea
stars, crabs, lobster,
some benthic fish
|
|
Common
Name: Tube-dwelling
anemone
Scientific
Name: Pachycerianthus
fimbriatus
Habitat
Preference: fine
sand or mud
Prey: small
zooplankton, detritus,
small animals that get
caught on tentacles
Predators: nudibranchs,
sea stars, some
bottom-feeding fish
(cod, flounder,
haddock)
|
|
Common
Name: Sea
anemones
Scientific
Name: Corynactis
californica
(strawberry anemone),
Metridium senile
(plume anemone)
Habitat
Preference: rocks
Prey: zooplankton,
detritus, small animals
that get caught on
tentacles
Predators: nudibranchs,
sea stars,
bottom-feeding fish
|
|
Common
Name: Crabs
Scientific
Name: Cancer
magister (dungeness
crab), Pagurus
samuelis. (hermit
crab)
Habitat
Preference: boulders,
gravel
Prey: phytoplankton,
protozoa, small
detritus
Predators: nudibranchs,
sea turtles, sea
urchins, sea
stars
|
|
Common
Name: Bryozoans
Scientific
Name: Filicrisia
franciscana
Habitat
Preference: rocks
& shale
Prey: phytoplankton,
protozoa, small
zooplankton, small
detritus
Predators: nudibranchs,
crabs
|
|
Common
Name: Tunicate
(carnivorous)
Scientific
Name: Megalodicopia
hians
Habitat
Preference: deep
area of canyon walls
Prey: copepods,
krill, & other
zooplankton
Predators: unknown
|
|
Common
Name: Giant
tube worms (grow up to 1
meter long)
Scientific
Name: Riftia
spp.
Habitat
Preference: hot
hydrothermal vents found
on the deep seafloor of
the canyon; shale and
mud
Prey: chemosynthetic
bacteria live in the
worms tissues and
provide nutrition
Predators: unknown
|
|
Common
Name: Sand
dollar
Scientific
Name: Dendraster
excentricus
Habitat
Preference: fine
sand & muddy
bottoms
Prey: benthic
algae, bryozoans,
encrusting sponges,
small detritus, small
copepods
Predators: sheephead,
starry flounder, pink
sea star, gulls
|
|
|
|
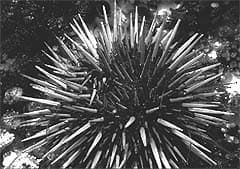
Common
Name: Purple
sea urchin
Scientific
Name: Strongylocentrotus
purpuratus
Habitat
Preference: rocky
outcrops
Prey: benthic
algae, small detritus,
plankton
Predators: sea
stars, some fishes
(California sheephead),
sea otters, &
humans
|
|
Common
Name: Common
squid
Scientific
Name: Loligo
opalescens
Habitat
Preference: open
water, muddy sand (for
spawning)
Prey: shrimplike
crustaceans, small
fishes, benthic worms,
& their own
young
Predators: Many
fishes, birds, marine
mammals & humans
|
|
Common
Name: Blue
rockfish
Scientific
Name: Sebastes
mystinus
Habitat
Preference: kelp
plants & rocky
areas
Prey: mollusks,
squid, crustaceans,
worms,
Predators: bigger
fishes, young preyed
upon by many pelagic
species, humans
|
|
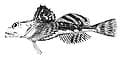
Common
Name: Cabezon
Scientific
Name: Scorpaenichthys
marmoratus
Habitat
Preference: rock
& gravel
Prey: demersal
fish, abalone,
crustaceans, mollusks,
echinoderms, worms, also
scavenges on
carcasses
Predators: humans
|
|
Common
Name: Tidepool
sculpin
Scientific
Name: Oligocottus
maculosus
Habitat
Preference: shallow
rocky areas
 Prey: demersal
fish, crustaceans,
mollusks, echinoderms,
worms, also scavenges on
carcasses Prey: demersal
fish, crustaceans,
mollusks, echinoderms,
worms, also scavenges on
carcasses
Predators: young
eaten by many bottom
fish
|
|
Common
Name: California
halibut
Scientific
Name: Paralichthys
californicus
Habitat
Preference: fine
or coarse sand
Prey: small
fishes, crustaceans
Predators: pelagic
and benthicl fish,
squid, marine mammals,
sea birds
|
|
Common
Name: Pacific
herring
Scientific
Name: Clupea
harengus
Habitat
Preference: open
water, gravel for egg
laying
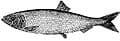 Prey: small
fish, zooplankton
(especially copepods),
amphipods, mysids,
shrimps, worms Prey: small
fish, zooplankton
(especially copepods),
amphipods, mysids,
shrimps, worms
Predators: many
pelagic and benthic
fish, squid, marine
mammals, sea birds,
humans
|
|
Common
Name: Lanternfish
Scientific
Name: Myctophidae
Habitat
Preference: open
water in the deep
sea
Prey: copepods
& euphausiids
Predators: deep
sea fish such as
barracudinas &
squid
|
|
Common Name:
Speckled sanddab
Scientific
Name: Citharichthys
stigmaus
Habitat
Preference: fine
sand
Prey: Mostly
crustaceans, plus worms
and fishes.
Predators: Diving
birds like cormorants,
marine mammals, crabs,
and other fishes
|
|
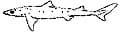
Common
Name: Spiny
dogfish
Scientific
Name: Squalus
acanthias
Habitat
Preference: gravel,
sand
Prey: small
fish (pelagic and
benthicl), squid,
crustaceans, bivalves,
worms, jellyfish,
salps
Predators: other
dogfish, large sharks,
humans
|
|
Common
Name: Shiner
surfperch
Scientific Name:
Cymatogaster
aggregata
Habitat
Preference: kelp
forest, rocks
 Prey:
Eats small crustaceans,
algae, and sometimes
worms and molluscs. Prey:
Eats small crustaceans,
algae, and sometimes
worms and molluscs.
Predators: Birds,
fishes, and marine
mammals. Often caught by
sportfishermen, usually
from piers.
|
|
Common
Name: Northern
anchovy
Scientific
Name: Engraulis
morda
Habitat
Preference: open
water
Prey: Filters
phytoplankton and
zooplankton through its
fine gill rakers.
Predators:
Virtually all
predatory birds, fishes
(including white
croakers), and mammals
eat anchovies. Some
pizza-lovers too. Often
used as bait.
|
|
Common Name:
Bat ray
Scientific Name:
Myliobatis
californica
Habitat
Preference: sand
& mud
Prey: Clams,
oysters, snails, crabs,
and worms.
Predators: Some
humans, and possibly
hammerhead sharks
|
|
Common Name:
Leopard shark
Scientific Name:
Triakis
semifasciata
Habitat
Preference: sand
& mud
Prey:
Bottom-dwelling fishes
and invertebrates.
Predators: Humans
are the main predators
of adult sharks. Young
ones may be vulnerable
to marine mammals, adult
sharks, and large
fishes.
|
|
|
|
|
a PDF version of this file can be found in the fullcurr.pdf
document (2.7mb)
|