Chemical Oceanography
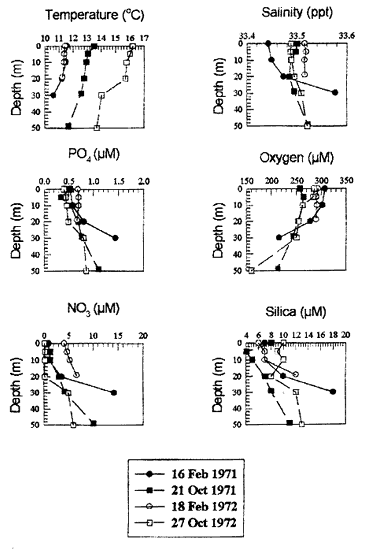
Figure 1
Vertical profiles of temperature, salinity, and nutrients from Moss Landing Marine Lab hydrographic station 10 (36 o 45.6' N; 121o 52.0'W) for February and October 1971 and 1972 (Created from data in Broenkow, 1972; Broenkow and Benz, 1973). The February 1971 and February 1972 profiles were reported as upwelling periods (Smethie, 1973)

